
Happy Birthday, Zettlr!
Today is the second birthday of Zettlr. Exactly two years, or 730 days, ago, on December 26th, 2017, version 0.5 of Zettlr was publicly released on GitHub. It’s actually incredible, how long this app has been going—from a small project I started in my free time to something really huge.
Last year we bumped the version to 1.0 as a birthday present, but as I have reiterated multiple times already, the “real” version 1.0 was reached when we released Zettlr 1.3, so this year Zettlr will not receive a major version update. Instead, I’ll fulfil a promise I’ve made a few months ago on Twitter when I posted a screenshot from our Matomo instance, showing the huge outreach Zettlr already has:
Here, an example that might illuminate better what insights these data can give you — you can even spot the disconnection of Africa to the global internet in general pic.twitter.com/UWAZ7ixg35
— Zettlr (@zettlr) August 26, 2019
Back then, I promised to be releasing the results of the data that has amassed over the past years to show you how an app can proliferate globally. This data gives a nice insight so that we know how Open Source is being used all around the globe. So let’s dive in!
What does GitHub say?
The first stop on our journey through the numbers begins at GitHub, because as a strict Open Source software, Zettlr relies upon GitHub for hosting all binaries and the code. Whenever someone downloads the application, it’s never being downloaded from zettlr.com, but only from the GitHub releases page. These statistics are public, but in case you never had a look at what GitHub can tell, here is some first information:
According to GitHub, all 59 releases of Zettlr have in total been downloaded 91,797 times. The first release was made exactly 730 days ago today, which is what we would expect. On average, the application has been downloaded 125.75 times per day. And the platforms? Well, the internet reflects itself here:
| Operating System | Number of Downloads |
|---|---|
| Windows | 56,851 |
| macOS | 16,471 |
| Debian-based Linux | 12,304 |
| Fedora-based Linux | 5,580 |
| AppImage (only version 1.5) | 168 |
Continuing, on the Zettlr repository there are currently 61 open and 363 closed issues and two Pull Requests. That number of open issues has been lower months ago, but I’m happy it did not reach the insane amount of over 1,000 open issues that are over at the Electron framework’s GitHub repository.
How many People are using Zettlr?
But simply downloading can mean as far as to begin the download and then abort it again. So I went to the Zettlr API, politely wished Merry Christmas and asked for some data, and the API vomited 2.3 megabytes of CSV data back at me. Let’s have a look inside!
Over the past year, a total of 18,615 applications have been registered with the API, out of which approximately 1,000 are active each week. Nevertheless, a large number of 5,491 applications can be considered inactive (hence, the users have downloaded it, started it once, and then never touched it again), because their last check-in is more than six months in the past. This is an interesting finding, because it validates the assumption that many users try several different apps before sticking with one. Additionally, sometimes users might simply want to have a look at the app and then decide that it’s not actually what they want.
But it also shows the difficulty in determining how many people actually use any application. The data from the API works a little bit like surveys to determine the amount of people who watch a certain TV station. No TV station can for certain ascertain the exact number of people watching its program, and so can’t any desktop application. This is why many application providers switch to SaaS (Software-as-a-Service) models, because when users have to be online, these businesses can control the amount of users much better and therefore collect a lot more data. And this is precisely the reason why we will never require user logins for the app.
But what else can we say based on the numbers? Well, on average, applications have checked in seven times. But this number is not really informative, because one application has checked in 2,858 times over the past year. This application is me, because I have to start and re-start Zettlr multiple times a day to test features. Many other apps only check in once—and that includes all the inactive ones as well. If I had to guess, based on the standard deviation of the data, the average user starts the app every other day.
Another measurement we really need is the amount of users that actually want to receive beta update notifications. This number helps us to determine how many people will be able to spot bugs during beta phases, and therefore can help us make a stable release. Of all applications, only one percent accepts beta versions, which amounts to nearly 200 applications in absolute terms. Thanks to those of you who choose to retrieve beta versions, because this helps us make the app better for everyone!
Zettlr is Being Used All Around the World
But now to the stuff that’s been indicated by the analytic from our website: Is Zettlr truly being used globally, or is this just a skewed image, brought about by many web scrapers? According to the data, Zettlr has been downloaded by people from 3,561 cities in 129 different countries around the world.
Interestingly, the most prevalent country was China with 2,835 applications, and the city of Beijing with 444 applications. We seriously did not expect that, especially given the fact that over on Twitter we mainly interact with German, French, and US-American scholars. But this explains why the Chinese translation over on Zettlr Translate is almost always complete and can be regarded as one of the most active translations. But what were the most important cities? Let’s have a look:
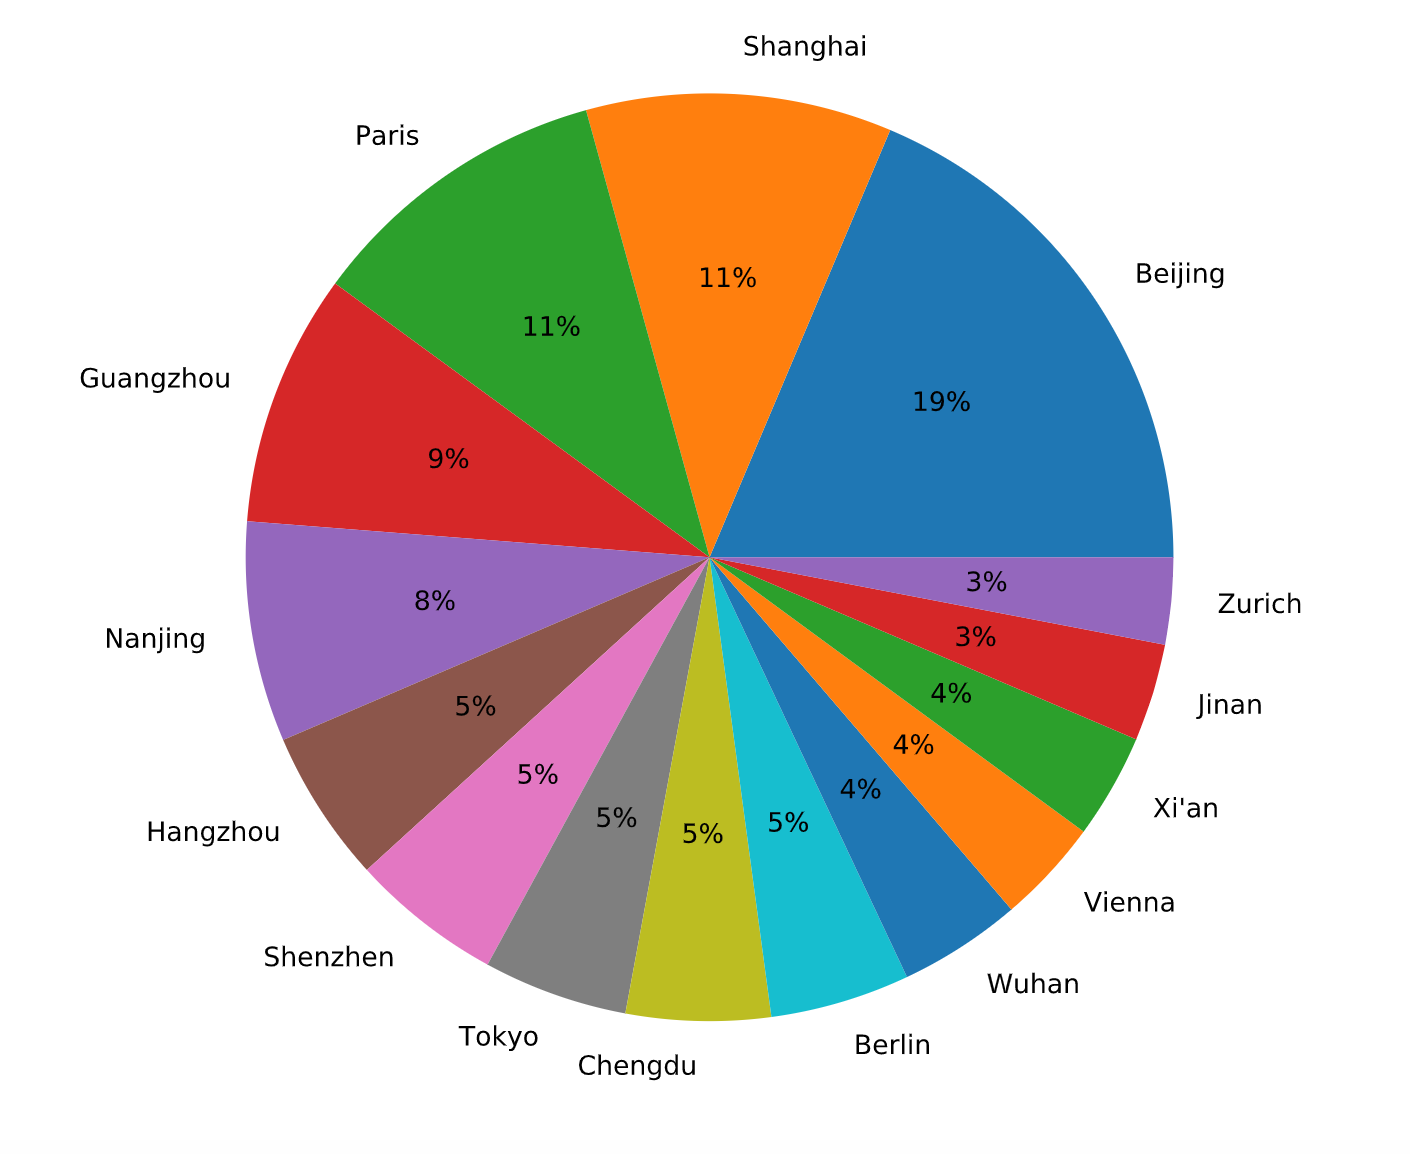
As you can see, the top 15 cities include ten Chinese cities. The non-Chinese cities are Paris, Tokyo, Berlin, Vienna, and Zurich. So we can hypothesise that most users outside of China come from France (which we expected), and the rest from the German-speaking countries Germany, Austria, and Switzerland. But statistics based on cities can severely skew the impression one gets, because city sizes vary widely around the world. Paris is a huge metropolis, just as Tokyo. US-American cities, on the other hand, are for the most part rather small (they make up for that simply by having a lot of them). Apart from New York, Los Angeles, and San Francisco, there are not that many metropolises in the United States. Additionally, for this statistic we only looked at cities with at least 70 applications registered, so the smaller cities had no chance.
So, how are the countries doing?
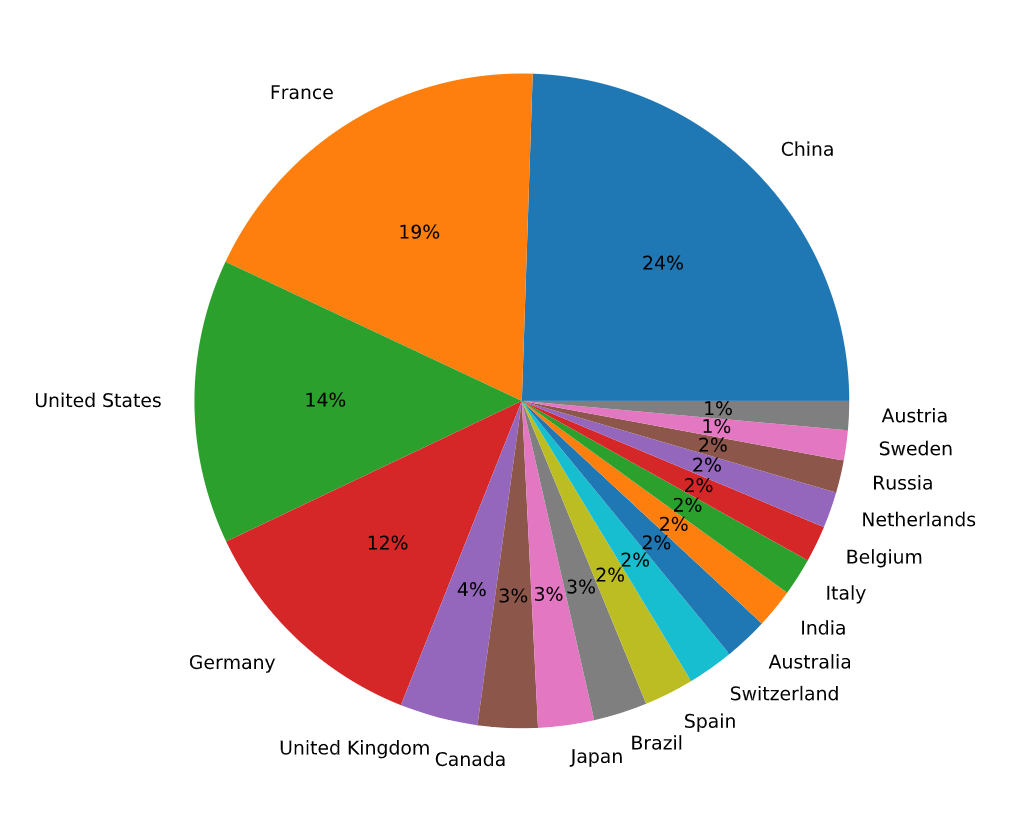
As we can see, China still makes up the largest part of all applications, but this time the United States is positioned higher than Germany and Japan. Furthermore, Austria and Switzerland only amount to three percent of the pie. The image we get here is much different, as we expected. It shows us that there are four major communities around the world: China, France, the United States, and Germany. As China blocks access to Twitter for the most part, this explains the missing Chinese interaction there.
One thing we were also curious about is the fact when all of these users began using Zettlr. Could we, in other words, see when the app began circulating in certain countries? Let’s have a look at the dates of the applications’ first contact with the API:
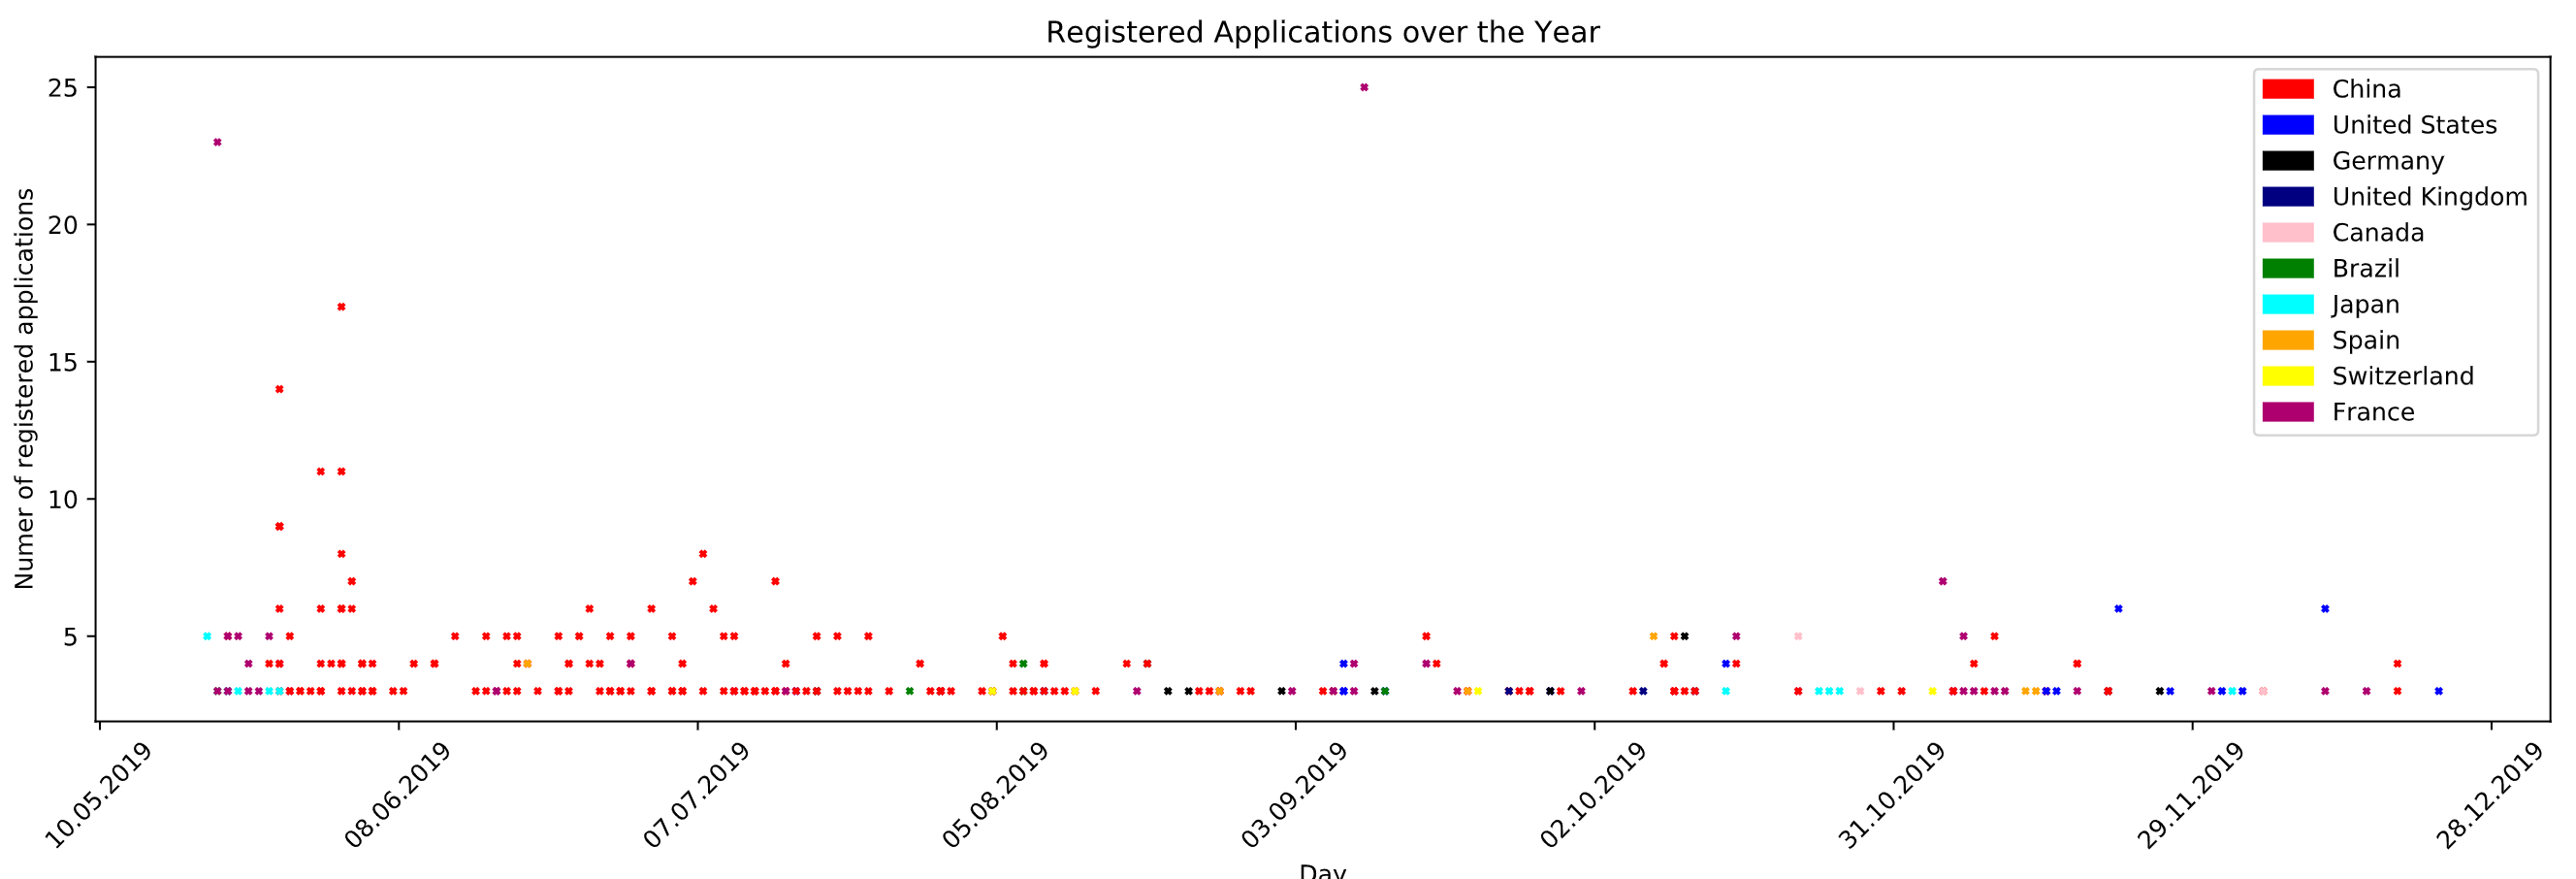
It’s not easy to decipher that, so let’s explain: Each dot represents one city of the ten most represented countries (listed in the legend) per each day where there were new applications, and the colour of it represents the country. The x-axis denotes the day of first contact, while the y-axis denotes the number of applications that made first contact during that day.
Chinese users were frequent until September 2019, when their numbers began to fade. Japanese users seemed to be drawn to the app in May and in October, albeit in smaller numbers. Interestingly, the French users have two huge spikes, one in May and one in September, where during a short amount of time a large number of people seemed to have downloaded the app. The United States, it seems, have begun to download the app in September, and then again in November. While we cannot explain all of the ups and downs, at least the spike in French users downloading the app in September can be explained, because that was when Arthur Perret published his blog post with a recommendation of Zettlr.
So the application is really being used worldwide, which makes us proud to see. After all, our main drive is to create something for as many people as possible, which is also why we are happy to see how well Zettlr Translate is doing.
Translations of Zettlr
The translation service of Zettlr enables users to help translate the app into (currently) 62 different languages. The app itself contains 544 different sentences, words, and particles that can be translated (anything from the description of certain preferences items down to “OK” buttons).
Currently, 76 users have translated these 544 translatable pieces 9.295 times. Nine languages are fully translated, five languages are translated so well that the missing translations should not negatively impact the usability. Ten further languages contain at least one translated phrase. That means, overall users have translated the app into 24 different languages!
The Community
Finally, let’s have a look at the community of Zettlr. We now know they come from all around the world, but who’s actively engaged? Well, on GitHub there are 85 forks of the app, which means that 85 people are ready to help make the app even better! Out of these, 17 people have already proposed Pull Requests, seven of which are now contributors to the app. 984 people have starred the repository, meaning that these people like the app or at least are still considering it for further use. On Twitter, where we announce most things, 375 people follow us already. If you want to stay up to date with everything, you can also consider following us there!
Last but not least, over at our community forums, we already count 361 users actively engaging in discussions around the app, and the forum is being visited heavily everyday. Our YouTube Channel already counts 228 subscribers, growing steadily. These numbers really motivate to continue everyday to enhance the application!
Wrapping Up
We are very proud to see that Zettlr resonates with people all around the globe and we can look back at two very successful years of transparent interaction with the community. Back in November 2017, when I began work at the app, I never thought I would at one day write such a blogpost, let alone see the application’s second birthday. It really motivates me seeing all of these people using the app and suggesting cool new features, many of which will come in 2020, and while maintaining the app becomes harder everyday, these numbers tell me that it’s the right way. To the next two years of Zettlr!
One last word to the data we have presented in this blogpost: all of the data is skewed to a lesser or larger extent, because we do not monitor our users. If someone is simply offline while using the app, for instance on the train, this data point is missing and we don’t care to retrieve it later on. Furthermore, the API will contain faked data and we do not make any attempts at resolving proxy addresses; several apps will be registered multiple times because the information never contains any information that could be used to identify any computer, so we cannot and will not verify that. We only collect coarse data points that help us identify areas where we need to put more emphasis. This means, while we wanted to share all of these insights with you, enjoy them with a grain of salt ;)